| 
                  When working with exponential models you may be given the function needed in the problem, or you may be asked to create the function needed for the problem. Let's tale a look at some strategies to keep in mind when working with exponential functions. 
                 Working with Given Functions: 
                  
                   
                 The population of a remote village is 1200 people in the year 2020. The annual growth rate is 1.4%. The situation is represented by the exponential growth formula P(t) = 1200(1.014)t,  
                 where t is the number of years since 2020. Find the population of the village in 2024. 


                       | Read Carefully: The time in this problem is "the number of years since 2020". | 


                 Solution: The time will be 4 years. 
                 Substitute into the given function:  P(4) = 1200(1.014)4
                 = 1268. 
                 Remember you cannot have a fraction (or decimal) part of a person.
                  x 
                   
  
                   Creating  Functions: 


                    Find a bank account balance to the nearest cent, if   					the account starts with $100, has an annual interest rate of 4%, and   					the money is left in the account for 12 years. 


                         Read Carefully: Think about what is happening in the problem. 
                         See how the increase affects the outcome. | 


                   Solution: The time will be 12 years. 
                     At start = 0, the account has = $100 
                     At year = 1, the account has  = 100 + 0.04(100) = 100(1+0.04) = 100(1.04) = $104  
                     At year = 2, the account has = 100(1.04)(1.04) = $108.16 
                     At year = 3, the account has = 100(1.04)3 = $112.49 
                     And so on ... 
                     Think about the pattern being used to solve this question. 
                     Write a function, based upon your observations, to solve the problem:  
                     M(t) = 100(1.04)t 
                   Answer: M(12) = 100(1.04)12 = $160.10 


                   a) The height of a pile of landscape debris at a landfill
                 increases by 40% every two weeks. If the initial height of the pile is 8 feet, what is the height after 6 weeks?  


                       Read Carefully: The time in this problem is "every two weeks". 
                       See how it affects the thinking in this problem. | 


                 Solution: The time will be 2 week intervals. 
                   At time = 0, the height = 8 feet 
                   At time = 1 (2 weeks), the height = 8 + .40(8) = 8(1+.40) = 8(1.4) = 11.2 feet  
                   At time = 2 (4 weeks), the height = 8(1.4)(1.4) = 15.68 feet 
                   At time = 3 (6 weeks), the height = 8(1.4)(1.4)(1.4) = 21.952 feet 
                   Yes, you could also create the function first, and then substitute in 3 for the time. 
                 b) Express a function L(t) to represent this situation, where t = time in 2 week intervals. 
                 L(t) = 8(1.4)t 
                 Answer:  L(3) = 8(1.4)3 = 21.952 feet  


                 In 1995, there were 85   									rabbits in Central Park.  The   									population increased by 12% each year.    									 
                 How many rabbits were in Central Park in   									2005?  Prepare a chart to show the growth, an exponential function, and a graph to support your answer. 


                       Connecting the problem to a chart and a graph. 
                       Examine all aspects of the problem. | 


                    Prepare a chart to show the growth: 


                         |  Years | 
                         1 
                           1996 | 
                         2 
                           1997 | 
                         3 
                           1998 | 
                         4 
                           1999 | 
                         5 
                           2000 | 
                         6 
                           2001 | 
                         7 
                           2002 | 
                         8 
                           2003 | 
                         9 
                           2004 | 
                         10 
                           2005 | 
                        
                       
                          Number of Rabbits 
                           (Round to the nearest rabbit.) | 
                         95 | 
                          106 | 
                         119 | 
                          133 | 
                          149 | 
                          167 | 
                          187 | 
                          210 | 
                          235 | 
                          263 | 


                  Function:   y = 85(1+0.12)x    
                 85(1.12)10 = 263 rabbits  


                       Plot the data and graph the   									function.   
                            horizontal axis = year (1 = 1996) 
vertical axis =   									number of rabbits 
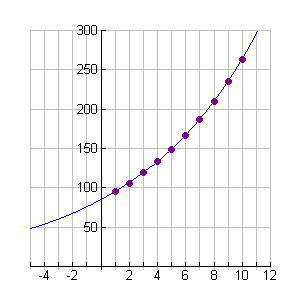
  | 
                         
                          
                         263 rabbits | 


                 A scientist has discovered a new strain of   				bacteria.  The bacteria culture initially contained 1000 bacteria   				and the bacteria are doubling every half hour.   Prepare a chart to illustrate the growth, an exponential function, and a graph for the data.   
                 Determine how many bacteria are present after 45 minutes. 


                       Read carefully: Address the half hour time with the 45 minute solution. 
                         Be careful with estimating on an exponential graph.                        | 


                       Chart: 


                              Time   												intervals 
                               30 minutes | 
                             1 
                               .5 hr | 
                             2 
                               1 hr | 
                             3 
                               1.5 hr | 
                             4 
                               2 hr | 
                             5 
                               2.5 hr | 
                             6 
                               3 hr | 
                             7 
                               3.5 hr | 
                             8 
                               4 hr | 
                             9 
                               4.5 hr | 
                             10 
                               5 hr | 
                            
                           
                             |  Bacteria present | 
                              2000 | 
                              4000 | 
                              8000 | 
                              16000 | 
                              32000 | 
                              64000 | 
                              128000 | 
                              256000 | 
                              512000 | 
                              1024000 | 
                            
                           
                             |  Pattern: | 
                              1000*21 | 
                              1000*22 | 
                              1000*23 | 
                              1000*24 | 
                              1000*25 | 
                              1000*26 | 
                              1000*27 | 
                              1000*28 | 
                              1000*29 | 
                              1000*210 | 


                     Function:  y = 1000(1 + 100)x                     									From chart:   y = 1000 • 2x 


                        Graph:   
                        horizontal axis = 30 min.   						time intervals 
                        (1 = 30 min, 2  = 
                        60 min, etc) 
                         vertical axis = number of bacteria 
                            | 
                           
                          
                       2828.4271 bacteria after 45 minutes  | 


                  Find the number of bacteria present   				after 45 minutes.   
                   From looking at the data table:  45 minutes is half way   				between 30 minutes and one hour.  If this process were   				"linear" we could make an estimate of the bacteria to be half   				way between 2000 and 4000 which would be 3000 bacteria.    				However, exponential growth is not linear.  If you examine   				the graph on your graphing calculator, the number of bacteria at 45 minutes equals    				2828.4271 bacteria. 


                 In 2000, 50 grams of radium were   							stored.  The half-life of radium is 1,620   							years.  How many grams of radium remains after   							4860 years?  Prepare a chart, function, and graph for the first three time periods. 
                 Remember, half-life is the amount of time it takes for   									half of the amount of a substance to decay.  


                       | Read carefully: Address the half life as being a reduction of 50%.  | 


                  Function:   y = 50(1 - 0.5)x                         									From chart  pattern: y = 50 / 2x 
                   50(0.5)3 = 
                 6.25 grams remain 
                 Plot the   							data and graph the   							equation for the first 3 time intervals. 
                    							horizontal axis = end of half life cycle 
                   vertical axis =   							grams of radium remaining 
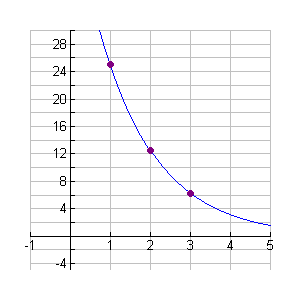


                         | 
                         
                          
                       6.25 grams remain | 


          NOTE:  The re-posting of materials (in part or whole) from this site to the Internet 
            is  copyright violation 
            
            and is not considered "fair use" for educators. Please read the "Terms of Use".   | 
         
    |