|
 |
We have seen that functions can be presented in a variety of formats:
written descriptions, tables/charts, equations and graphs.
These formats can also be used to compare functions to one another. |
As such, you need to be familiar with how to read and interpret each of these formats.
Consider the following examples:
 Comparing Functions in the same formats: Comparing Functions in the same formats:
Exponential Function 1: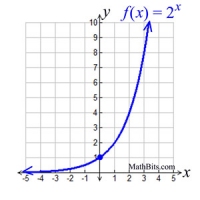
|
Linear Function 2: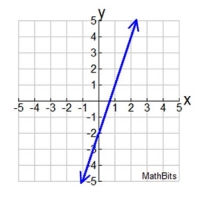 |
Quadratic Function 3: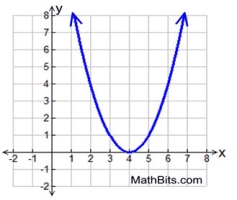 |
Questions pertain to the three function graphs shown above.
a) Which function has the largest y-intercept?
b) Which function has the largest root (zero) value?
c) Which function does not intersect with Quadrant IV?
d) Which function will have the largest y-value when x = 100?
e) Which function has no x-intercept?
While the equation for function 1 was given, the equations for functions 2 and 3 are needed to answer the questions. Use the graphs to create the equations.
Answers: a) Function 3 b) Function 3 c) Functions 1 and 3 d) Function 1 e) Function 1
Analysis of the Functions:
Function 1: exponential, y-intercept at (0,1), no x intercepts, y > 0, f (100) = 2100= 1.2676506E30,
Function 2: linear, y-intercept at (0,-2), equation y = 3x - 2, x-intercept (root) at x = 2/3, y = 3(300) - 2 = 898
Function 3: quadratic, x-intercept at 4 (repeated root), equation y = x2 - 8 + 16 , y = 1002 - 8(100) + 16 = 9216
 x x
 Comparing Functions in different formats:
Function A:
a line with a slope of 4 passing through the point (2,7)
|
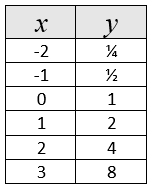
Function: B
y = x² - x - 2 |
Function: C
:
|
Questions pertain to the three functions shown above.
a) Which function has the smallest y-intercept?
b) Which function has the greatest rate of change on the interval 0 < x < 10?
c) Which function's graph never enters Quadrant II?
Answers: a) Function B b) Function C c) Functions A
Function A: linearl, y = 4x - 1, y-intercept at (0,-1), rate of change = 4
Function B: quadratic, y-intercept at (0,-2), average rate of change = 16 / 10
Function C: exponential, y-intercept at (0,1), equation y = 2x, average rate of change = 1023 / 9
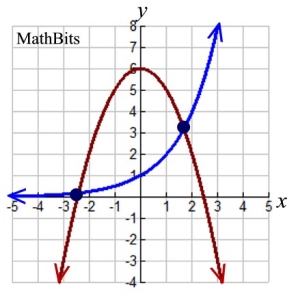
 Comparing Function Graphs: Using your graphing calculator (or utility), graph the functions f (x) = 2x and g(x) = -x2 + 6.
a) Graph the functions on the same set of axes.
b) Determine the points of intersection of the graphs. Round answers to three decimal places.
c) Describe the meaning of the equation f (x) = g(x) in relation to this problem.
a) The blue graph: f (x) = 2x
The red graph: g(x) = -x2 + 6
b) Determined by the graphing calculator, the functions cross at the points (-2.411, 0.188) and (1.675, 3.194).
c) Regarding f (x) = g(x):
The two functions are equal to one another at their points of intersection. For this problem, there are two values for x
(x = -2.411 and x = 1.675) for which the functions are equal. The equation f (x) = g(x) has two solutions in this problem, which can translate to the equation
2x = -x2 + 6 having two solutions. |
 |
 |
Directions for finding intersection points for graphs
on the TI-84+ family of calculators.
Quick Reference Sheet |

NOTE: The re-posting of materials (in part or whole) from this site to the Internet
is copyright violation
and is not considered "fair use" for educators. Please read the "Terms of Use". |
|